Classifying and Solving the Events in Progress Problem in PowerPivot
Reposted from Jason Thomas blog with the author's permission.
Last week, I was going through the PowerPivot forums as usual and was answering a question on How to handle count of data with “valid to/from” dates in DAX. This was a classic case of the “Events in Progress” or finding the number of active events between a start date and an end date (In case you haven’t read, Chris Webb (blog | twitter) has got some great posts on the Events in Progress solutions using both DAX and MDX). I replied back with a possible solution and soon, Marco Russo (blog | twitter) came up with a much more elegant solution. But more than the solution, what caught my eye was that our results were not matching and after a few email exchanges with Marco (and a big thanks to Marco for taking time off to answer my questions), we came up to the conclusion that it was because of the difference in our interpretations of the Event in Progress. That is when I thought of classifying the different interpretations of the “Events in Progress” as well as extending Marco’s solution for the same.
In a typical Events in Progress problem, there are fact rows with a start and end date and each row denotes an event. The requirement would be to find the number of events that were in progress on any given date. At a date level, there is no ambiguity as the number of events in progress for a particular day, say D would be the number of those events whose start date is less than or equal to D and the end date is greater than or equal to D (Actually, you can further sub-categorize this into whether the start dates and end dates are inclusive or exclusive i.e. whether the start date is less than or less than or equal to D and whether end date is greater than or greater than or equal to D. For the sake of simplicity, we are assuming that both start and end dates are inclusive). However, the moment you start analysing on a level above the dates, say a month or a year, the question arises on which date of the month to use for comparing the start and end date. Should we be using the first date of the month? Or the last date of the month? Or should we be using a combination of both? There is no wrong answer here and the right definition completely depends on the business requirement. So let us look at the four possible combinations that are possible:-
To give an example, say we are analysing the events in progress for January 2012. For Scenario S2, this would mean the number of events which have a From Date (or start date) less than or equal to January 1 2012 (which is the minimum date for January 2012) and To Date (or end date) greater than or equal to 31 January 2012 (which is the maximum date for the January 2012). Here also, we can further sub-categorize whether the start and end dates are inclusive or exclusive but this is not done for the sake of simplicity and also because our solution can easily be modified by removing the equal to symbol.
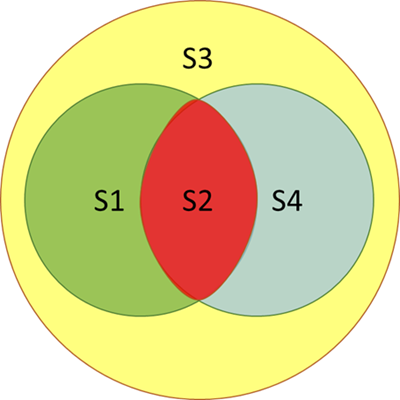
It might be easier to understand the relationship between the four scenarios with the help of a Venn Diagram.
As you can see, Scenario S3 is the superset and includes any event that was active on any date in the selected time period. Scenario S1 requires that the event started before the time period but can end during any day on or after the time period. Conversely, scenario S4 requires that the event started on or before the time period and ends on any day after the time period. Scenario S2 is the intersection of the scenarios S1 and S4 and requires that the event starts before the time period and ends after the time period. This means that those events starting or ending in the selected time period will not be counted.
Lets have a look at the four scenarios from a different visualization perspective.
Now that you have got a good idea of the different scenarios, let us look at some sample data that we can use for testing the solution. Given below is a simple fact table which contains Order Numbers with a From Date and To Date and also the Order quantity.
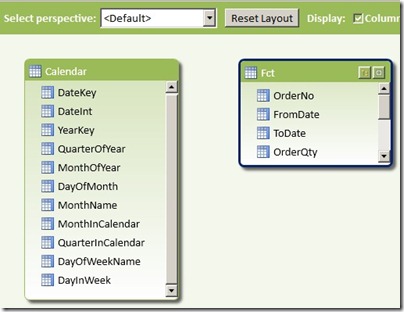
The PowerPivot data model that we are going to use is given below
I just have a simple calendar table (where I have just populated days from 2011 to 2013, again for simplicity) and the above Orders fact table. It is interesting to note that we will not be creating any relationships between the two tables as our solution does not require them. Now follow the steps below to get the solution for the four scenarios:-
1) Before we start, it might be a good exercise to review the original formula that I wrote and why we are moving to a different solution. The original formula I wrote was
OldMsr:=Calculate (
CountRows ( Fct ),
Filter (
Fct,
CountRows (
Filter (
Values ( Calendar[DateKey] ),
( Calendar[DateKey] >= VALUE ( Fct[FromDate] ) ) && ( Calendar[DateKey] <= VALUE ( Fct[ToDate] ) )
)
) > 0
)
)
To explain this formula, I am dividing it into 3 parts. The red highlighted area gives us the count of the fact rows which is the count of events in progress, provided the correct set of rows in the Fact table is passed as a table filter. Now to pass the correct table filter, we need to filter the fact table which is the part highlighted in orange and the condition to filter it is highlighted in yellow. Since we don't have any relations between the tables, what I am doing is to filter all the fact rows which has at least one row where there is a date greater than the From Date but less than the To Date. When we are analysing by month, what this will mean is that even if there is a single day in that month which satisfies the condition, include that fact row. This is exactly similar to our scenario S3.
Now some of the problems associated with this:-
- Formula is difficult to understand and write
- Formula can’t be easily changed to that of other scenarios
- Formula doesn’t perform well
2) Now let us look at the formula which was given by Marco in the forums
S3:= Calculate (
CountRows ( Fct ),
Filter (Values ( Fct[FromDate] ), Fct[FromDate] <= Max ( Calendar[DateKey] ) ),
Filter (Values ( Fct[ToDate] ), Fct[ToDate] >= Min ( Calendar[DateKey] ) )
)
You can already see how simple it is to understand. We are just passing the From dates which are less than the max of the time period and those To Dates which are greater than min of the time period as a table filter to the calculate statement and there is no need to filter the fact table explicitly. Not only that, it performs much better as it doesn’t have to parse through the entire fact table and just has to parse through two tables having the distinct values of From Date and To Date respectively (Always remember, it is faster to parse through two smaller tables than one big table). Now the best part is that this can be easily extended to the other scenarios as shown below
S1:= Calculate (
CountRows ( Fct ),
Filter (Values ( Fct[FromDate] ), Fct[FromDate] <= Min ( Calendar[DateKey] ) ),
Filter (Values ( Fct[ToDate] ), Fct[ToDate] >= Min ( Calendar[DateKey] ) )
)
S2:= Calculate (
CountRows ( Fct ),
Filter (Values ( Fct[FromDate] ), Fct[FromDate] <= Min ( Calendar[DateKey] ) ),
Filter (Values ( Fct[ToDate] ), Fct[ToDate] >= Max ( Calendar[DateKey] ) )
)
S4:= Calculate (
CountRows ( Fct ),
Filter (Values ( Fct[FromDate] ), Fct[FromDate] <= Max ( Calendar[DateKey] ) ),
Filter (Values ( Fct[ToDate] ), Fct[ToDate] >= Max ( Calendar[DateKey] ) )
)
Wasn’t that simple?
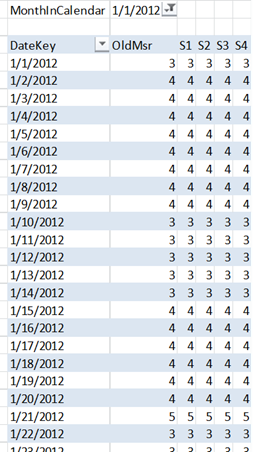
3) Now let us have a look at the results to make sure everything is coming correctly.
I have filtered for January 2012 and you can see that the dates in that table are showing the same values for all the five measures. Let us pick 10 January 2012 as an example. Only 11001, 11003 and 11004 suffice the conditions and hence the measures are all 3. The results come up correctly even if we look at a month or year level.
Let us take January 2012 as an example, so the max will be 31 Jan 2012 and minimum will be 1 Jan 2012. The order numbers which match the given conditions are given below and matches with the measure counts
S1 = 11001, 11002, 11003
S2 = 11001, 11003
S3 = 11001, 11002, 11003, 11004, 11005, 11006
S4 = 11001, 11003. 11006
4) Another benefit of this pattern is that it can easily be applied to other problems where you might need to find the sum or distinct count or any other aggregations between a from date and to date. Let us say, if I want to find the sum of Order Quantity between the from date and to date according to scenario S1, all I need to do is as follows
S1Sum:= Calculate (Sum ( Fct[OrderQty] ),
Filter (Values ( Fct[FromDate] ), Fct[FromDate] <= Min ( Calendar[DateKey] ) ),
Filter (Values ( Fct[ToDate] ), Fct[ToDate] >= Min ( Calendar[DateKey] ) )
)
If you want to try this on your own, feel free to download the completed excel file from here.
 | Jason has been working with Microsoft BI tools since he joined the IT industry in 2006. Since then he has worked across SSAS, SSRS and SSIS for a large number of clients like Unilever, Imperial Tobacco, IATA, Schneider Electric, etc. He is currently working at MindTree Ltd, Bangalore (www.mindtree.com) and his personal blog site can be found at http://www.sqljason.com His blogs can also be found at the popular technical site BeyondRelational.com at http://beyondrelational.com/blogs/jason |


