Slicer impact on PowerPivot query performance
User Rating: 4 / 5


Excel 2010 introduced slicers - a new cool way of filtering and slicing data. PowerPivot lets you easily add horizontal or vertical slicer by simply dragging any column into designated area. In the slicer you can see all column values and by clicking on one or multiple values you can filter pivot data results:
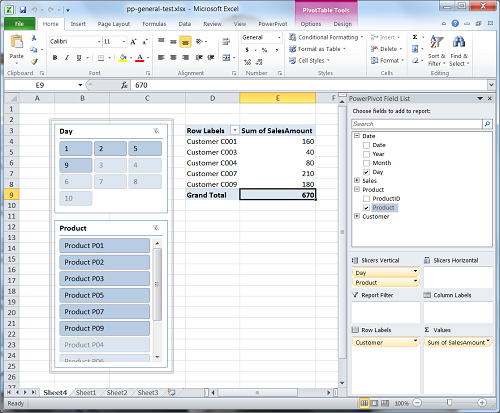
But slicers are not just showing all column values. Slicer also let you see what column values have data in the current pivot report. For example in the picture above you can see that slicer "Day" has values "1","2","5" and "9" in darker color and other values for that same column have lighter color (actual color is easy to change). This is because slicer is aware that some values, if selected, would not return any data for current Pivot table. I found this slicer behavior very useful, as just by looking at the slicer you can already make some assumptions about your data - for example in our example above we already know that we have no sales on some days and that some products where never sold. But this slicer behavior has some performance price associated with it. I am guessing that in majority of cases you will not notice any performance impact. But if you are running very complicated queries that take longer to execute, you should be aware that slicers might add to your query execution time.
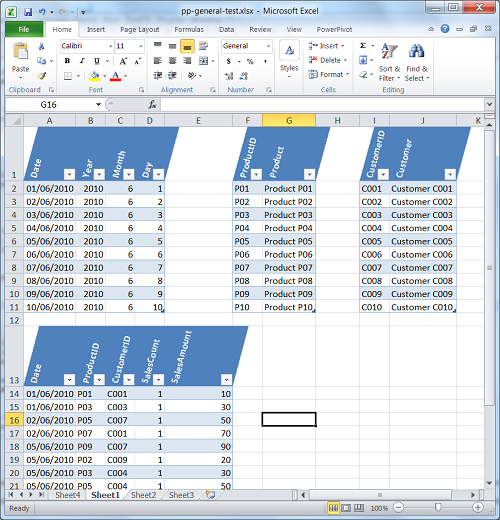
Lets create simple PowerPivot workbook with tables Product, Date, Customer and Sales. I just created few records for each table and below is a screenshot of my source data:
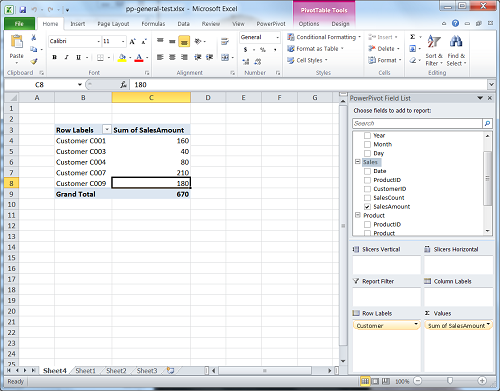
After creating simple table relationships, I created first Pivot table with CustomerName on the row and Sum of Sales Amount as measures. This sample report has no slicers.
Now we can use PowerPivot diagnostics option to see what MDX queries are executed to return back data. Our first report generates following MDX statement:
CREATE MEMBER CURRENTCUBE.Measures.[e7e8929e-38e4-43ec-8a5d-ea7c021105cc] AS 1, Visible=0;
ALTER CUBE CURRENTCUBE UPDATE DIMENSION Measures, Default_Member = [e7e8929e-38e4-43ec-8a5d-ea7c021105cc];
CREATE MEASURE [Sandbox].'Sales'[Sum of SalesAmount]=SUM('Sales'[SalesAmount]);
SELECT NON EMPTY Hierarchize({DrilldownLevel({[Customer].[Customer].[All]},,,INCLUDE_CALC_MEMBERS)}) DIMENSION PROPERTIES PARENT_UNIQUE_NAME,HIERARCHY_UNIQUE_NAME ON COLUMNS FROM [Sandbox] WHERE ([Measures].[Sum of SalesAmount]) CELL PROPERTIES VALUE, FORMAT_STRING, LANGUAGE, BACK_COLOR, FORE_COLOR, FONT_FLAGS
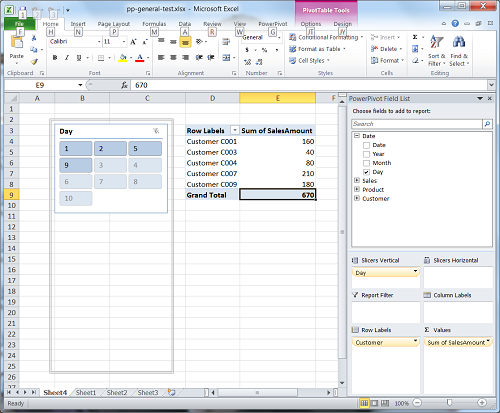
Now lets add our first slicer - Day column. Our new report will look like this:
Again, we will capture query that Pivot executes against internal Analysis Services database, and now we can see that new query is much longer:
with member measures.[608c34a1-2ae7-488d-914f-b13d22a5b239] as null select measures.[608c34a1-2ae7-488d-914f-b13d22a5b239] on 0, Union(head([Date].[Day].[Day], 500), tail([Date].[Day].[Day], 500)) on 1 from [Sandbox]
go
WITH MEMBER [Date].[Day].[XL_PT0] AS 'strtomember("[Date].[Day].[All]").UniqueName' SELECT {[Date].[Day].[XL_PT0]} ON 0 FROM [Sandbox] CELL PROPERTIES VALUE
go
SELECT NON EMPTY Hierarchize({DrilldownLevel({[Customer].[Customer].[All]},,,INCLUDE_CALC_MEMBERS)}) DIMENSION PROPERTIES PARENT_UNIQUE_NAME,HIERARCHY_UNIQUE_NAME ON COLUMNS FROM [Sandbox] WHERE ([Date].[Day].[All],[Measures].[Sum of SalesAmount]) CELL PROPERTIES VALUE, FORMAT_STRING, LANGUAGE, BACK_COLOR, FORE_COLOR, FONT_FLAGS
go
with member [Measures].__XLolapslicermembercount as [Date].[Day].[Day].allmembers.count
select { [Measures].__XLolapslicermembercount } on 0
from [Sandbox]
cell properties value
go
with
set __XLSlice0 as { [Customer].[Customer].[All] }
set __XLSlice1 as { [Measures].[Sum of SalesAmount] }
set __XLExistingMembers as
NonEmpty(
[Date].[Day].[Day].allmembers,
CrossJoin(__XLSlice0,
__XLSlice1)
)
set __XLExistingRangeMembers as SubSet(__XLExistingMembers, 0, 1000)
set __XLNonExistingRangeMembers as
Iif(__XLExistingRangeMembers.Count = 1000,
{},
SubSet( Except([Date].[Day].[Day].allmembers, __XLExistingMembers),
iif (0 - __XLExistingMembers.Count < 0, 0, 0 - __XLExistingMembers.Count),
1000 )
)
member [Measures].__XLRelated as Intersect( [Date].[Day].currentmember, __XLExistingRangeMembers ).Count
set __XLTargetSet as SubSet(Union(__XLExistingRangeMembers, __XLNonExistingRangeMembers), 0, 1000)
select { [Measures].__XLRelated } on 0,
__XLTargetSet on 1
from [Sandbox]
cell properties value
go
with member measures.[4fe32b96-c38e-41c7-8ca3-3bd13722734f] as null select measures.[4fe32b96-c38e-41c7-8ca3-3bd13722734f] on 0, Union(head([Date].[Day].[Day], 500), tail([Date].[Day].[Day], 500)) on 1 from [Sandbox]
go
After reviewing above query we can see that this time we have few more MDX statements and I highlighted few lines of code that generates set __XLExistingMembers that checks if silcer members have non empy values. This additional query may in some instances increase your query execution time, because it checks if there are non null values for each measure. Other additional queries are executed against columns that most likely cannot cause any performance issues.
Now lets add one more slicer - ProductName. Then results will look like first picture in this post, and now new generated MDX query will be even more complicated:
WITH MEMBER [Date].[Day].[XL_PT0] AS 'strtomember("[Date].[Day].[All]").UniqueName' SELECT {[Date].[Day].[XL_PT0]} ON 0 FROM [Sandbox] CELL PROPERTIES VALUE
go
WITH MEMBER [Product].[Product].[XL_PT0] AS 'strtomember("[Product].[Product].[All]").UniqueName' SELECT {[Product].[Product].[XL_PT0]} ON 0 FROM [Sandbox] CELL PROPERTIES VALUE
go
with member measures.[a62588e3-a770-44af-9564-53cd22505dd3] as null select measures.[a62588e3-a770-44af-9564-53cd22505dd3] on 0, Union(head([Date].[Day].[Day], 500), tail([Date].[Day].[Day], 500)) on 1 from [Sandbox]
go
SELECT NON EMPTY Hierarchize({DrilldownLevel({[Customer].[Customer].[All]},,,INCLUDE_CALC_MEMBERS)}) DIMENSION PROPERTIES PARENT_UNIQUE_NAME,HIERARCHY_UNIQUE_NAME ON COLUMNS FROM [Sandbox] WHERE ([Product].[Product].[All],[Date].[Day].[All],[Measures].[Sum of SalesAmount]) CELL PROPERTIES VALUE, FORMAT_STRING, LANGUAGE, BACK_COLOR, FORE_COLOR, FONT_FLAGS
go
with member [Measures].__XLolapslicermembercount as [Date].[Day].[Day].allmembers.count
select { [Measures].__XLolapslicermembercount } on 0
from [Sandbox]
cell properties value
go
with
set __XLSlice0 as { [Customer].[Customer].[All] }
set __XLSlice1 as { [Product].[Product].[All] }
set __XLSlice2 as { [Measures].[Sum of SalesAmount] }
set __XLExistingMembers as
NonEmpty(
[Date].[Day].[Day].allmembers,
CrossJoin(__XLSlice0,
__XLSlice1,
__XLSlice2)
)
set __XLExistingRangeMembers as SubSet(__XLExistingMembers, 0, 1000)
set __XLNonExistingRangeMembers as
Iif(__XLExistingRangeMembers.Count = 1000,
{},
SubSet( Except([Date].[Day].[Day].allmembers, __XLExistingMembers),
iif (0 - __XLExistingMembers.Count < 0, 0, 0 - __XLExistingMembers.Count),
1000 )
)
member [Measures].__XLRelated as Intersect( [Date].[Day].currentmember, __XLExistingRangeMembers ).Count
set __XLTargetSet as SubSet(Union(__XLExistingRangeMembers, __XLNonExistingRangeMembers), 0, 1000)
select { [Measures].__XLRelated } on 0,
__XLTargetSet on 1
from [Sandbox]
cell properties value
go
with member [Measures].__XLolapslicermembercount as [Product].[Product].[Product].allmembers.count
select { [Measures].__XLolapslicermembercount } on 0
from [Sandbox]
cell properties value
go
with
set __XLSlice0 as { [Customer].[Customer].[All] }
set __XLSlice1 as { [Date].[Day].[All] }
set __XLSlice2 as { [Measures].[Sum of SalesAmount] }
set __XLExistingMembers as
NonEmpty(
[Product].[Product].[Product].allmembers,
CrossJoin(__XLSlice0,
__XLSlice1,
__XLSlice2)
)
set __XLExistingRangeMembers as SubSet(__XLExistingMembers, 0, 1000)
set __XLNonExistingRangeMembers as
Iif(__XLExistingRangeMembers.Count = 1000,
{},
SubSet( Except([Product].[Product].[Product].allmembers, __XLExistingMembers),
iif (0 - __XLExistingMembers.Count < 0, 0, 0 - __XLExistingMembers.Count),
1000 )
)
member [Measures].__XLRelated as Intersect( [Product].[Product].currentmember, __XLExistingRangeMembers ).Count
set __XLTargetSet as SubSet(Union(__XLExistingRangeMembers, __XLNonExistingRangeMembers), 0, 1000)
select { [Measures].__XLRelated } on 0,
__XLTargetSet on 1
from [Sandbox]
cell properties value
go
with member measures.[5167c2ba-4cea-43a2-8a26-9db810ad30ac] as null select measures.[5167c2ba-4cea-43a2-8a26-9db810ad30ac] on 0, Union(head([Date].[Day].[Day], 500), tail([Date].[Day].[Day], 500)) on 1 from [Sandbox]
go
with member measures.[7c3e14bd-c2ff-41e6-9c48-3b58fd064501] as null select measures.[7c3e14bd-c2ff-41e6-9c48-3b58fd064501] on 0, Union(head([Product].[Product].[Product], 500), tail([Product].[Product].[Product], 500)) on 1 from [Sandbox]
go
In the code above I again highlighted additional queries that check if slicer has non empty values for current pivot. As this report has 2 slicers, now we have 2 additional queries that has potential to impact performance.
My suggestion is to use slicers as much as you can, because they are very helpful. But if you will start experiencing performance issues - consider changing some or all of your slicers to filters.
Tags: performance, excel, mdx, slicer