Gemini (PowerPivot) First Thoughts
Reposted from Chris Webb's blog with the author's permission.
So after almost a year of hype I’ve finally got my hands on the first CTP of Gemini! I’m currently on holiday (and yes, I take my laptop on holiday, though at least my wife does too so we’re as bad as each other) but I couldn’t resist downloading it and taking a look. Here are my first impressions… and as soon as I get back home I’ll post something more detailed.
- Installation was pretty straightforward on my Windows 7/Excel 2010 VM. Note that you do need Excel 2010 to use Gemini, as I suspected. The good thing is that it’s an addin rather than native Excel functionality so at least Gemini isn’t tied to the overall Office release cycle. I wonder how long it will be between versions?
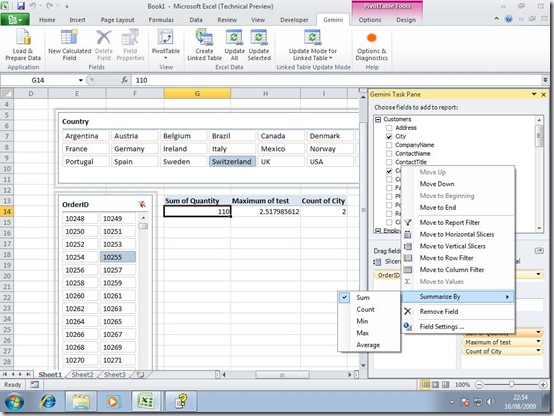
- When you open Excel, you see a new Gemini tab on the ribbon that looks like this:

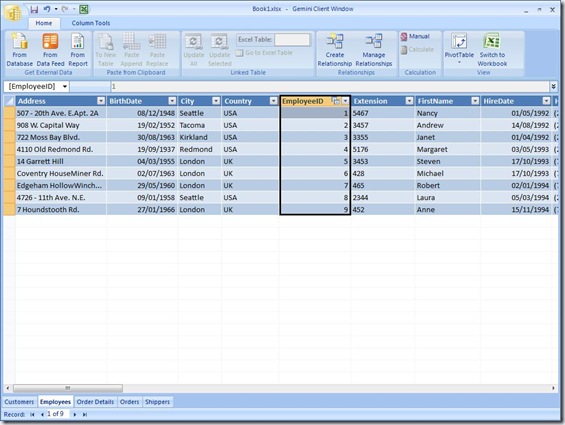
- The ‘Load and Prepare Data’ button starts the fun and allows you to pull in data from various sources. You can either select entire tables or write your own SQL, and again I found it all very easy to do what I wanted; clearly a lot of what’s been learned from the SSAS cube design wizard has been applied here to make the process as smooth as possible. You can also get data from SSRS reports using the new Data Feed rendering functionality that Teo discusses here, paste data in from the clipboard, and link a Gemini table to an Excel table (this is what the Create Linked Table button in the screenshot above does).
I can’t see much evidence yet of data preparation rather than just plain old loading, but that may well be yet to come. I’d also like to see a visual way of managing the relationships between tables, as you get with the SSAS DSV. Gemini doesn’t handle parent/child relationships yet; I’m not quite sure it handles other more complex types of relationship either but I need to play around a bit more here.
- You can create new columns in each of the tables that you load into Gemini and define what values they display using the new Data Analysis eXpressions (DAX) language. Now MS are seemingly keen to stress that DAX isn’t an MDX replacement and I suppose that technically that’s true, but let’s be honest, it’s doing the same job as MDX but trying to be more Excel-user-friendly. I’ve not had a chance to go deep into it at all yet but it certainly looks like there’s a lot to learn here. In the meantime, from the tutorial doc I’ve got, here’s an example of a DAX calculation that returns an average of Sales per State:
=CALCULATE(
AVERAGE('Total Sales'[SalesAmount]), ALLEXCEPT('Total Sales', 'Total Sales'[State or Province])
)
Is this easier than MDX? Will power users be able to write this? I honestly don’t know yet.
You can also control whether DAX calculations are updated automatically or only when you click the ‘Calculate’ button on the ribbon. - Once this is done it’s back to the worksheet to create a pivot table, and I’ve already blogged about what’s new here. Unlike a SSAS-bound pivot table, however, you can use any column as a measure and choose how it’s aggregated, using either a Sum, Count, Min, Max or Average (data type permitting). From playing around with it a bit more, the new Slicer functionality does really come in useful here. You can flip back and forth between the worksheet and the Gemini UI very easily.

- The ‘Options and Diagnostics’ button doesn’t do much except to allow you to dump the current state of the Gemini cube to a .trc trace file for further analysis.
Overall, there aren’t actually any surprises really. As I said DAX is something I’m going to need to study in a lot more detail; I can’t really comment on the scalability and performance because I’m running on a VM and don’t have a large dataset handy; and I don’t have Sharepoint installed so I haven’t checked out the integration there (which in any case is NDA at the moment). So far I like it; it’s also less of a threat to the kind of SSAS/MDX work I do than I thought it might be – it’s a lot simpler than I’d expected and it doesn’t feel cube-like at all but much more relational.
 |
Chris has been working with Microsoft BI tools since he started using beta 3 of OLAP Services back in the late 90s. Since then he has worked with Analysis Services in a number of roles (including three years spent with Microsoft Consulting Services) and he is now an independent consultant specialising in complex MDX, Analysis Services cube design and Analysis Services query performance problems. His company website can be found at http://www.crossjoin.co.uk and his blog can be found at http://cwebbbi.spaces.live.com/ . |
