PowerPivot Schema Flexibility
Reposted from Thomas Ivarsson blog with the author's permission.
In SSAS cubes we mostly use the starschema model with a central fact table and dimension tables as navigation paths down to the measures. That model will work in many scenarios and return valuable insights into business processes. In this model we do not connect fact tables to other fact tables directly but the relation appears with related dimensions.
With the arrival of PowerPivot much talk have been focused around DAX, the expression language, or formula language, for PowerPivot. I believe that this is only part of the story.
PowerPivot have a more flexible model where you can do this but also relate fact tables with different granularities directly to each other. This will give you added flexibility in a Pivot Table.
This is a recreation of a report scenario that I have tried on real production data but I will use one of the other Adventure Works demo databases that is more transaction oriented. I have created a product table(product attributes) and a date table(single dates, Year and YearMonth(200801) attributes. Fact tables are both SalesOrderHeader and SalesOrderDetail.
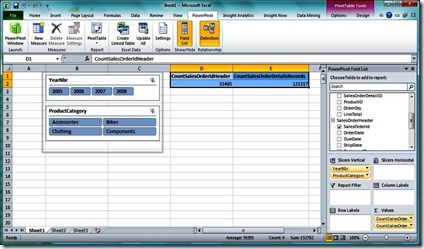
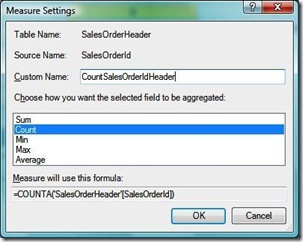
You will recognize the dimension tables as the slicers but I have used some TSQL code to build this in this more detailed version of the Adventure Works processes. The two fact tables are the OrderHeader table and the Order detail table. Both tables include the OrderNumber column that I have dragged to the values area and changed the formula from SUM to COUNT.
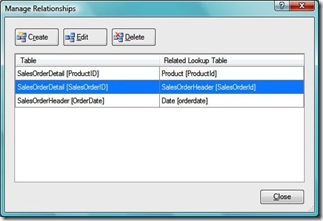
The relations tab in PowerPivot is where you create the more flexible model.
In this model Product is related to the SalesOrderDetail(ProductId) column and Date to the SalesOrderHeader table(OrderDate). SalesOrderDetail is related the SalesOrderHeader table with the SalesOrderId column.
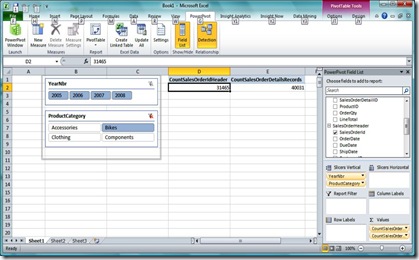
Finally, this is the behaviour in the Pivot Table with this setup.
Product categories and year level of the order date column are used as slicers above. If you click on a product category member in the slicer only the count measure of the SalesOrderDetail table will change(CountSalesOrderDetailsRecords).
If you click on single years both the CountSalesOrderHeader measure and the CountSalesOrderDetailsRecords will change, since the top fact table filters the lower fact table.
|
|
Thomas Ivarsson has been working with the MS BI platform since SQL Server 7 in 1999. Presently he is working in the telecom industry in Sweden, with a data warehouse based on SQL Server 2005. From 1999 to 2007 he worked as a consultant also on the three SQL Server BI platforms. During the latest years he has spent most of time on SSAS, Reporting Services, ProClarity and Performance Point. He also has several years experience of the ETL process with DTS and SSIS. During 2008 and 2009 he has been working with introducing data mining in his daily business to see patterns in a service network behaviours. His blog can be found here: http://thomasivarssonmalmo.wordpress.com/ |


